- Free OGG to MP3 Converter
- Free FLV to AVI Converter
- Free WMA to MP3 Converter
- Free MP3 To Wave Converter
- Free RM to MP3 Converter
- Free Mario Game
- Free XLS Viewer
- Free WAV to MP3 Converter
- Free Aquarium Screensaver
- Free DVDFab Decrypter
- Free Mobile 3GP converter
- Free PDF to Flash Converter
- Free MP4 to AVI Converter
- Free PDF to Word Converter
- Free MP3 to WAV Converter
- Free File List
- Free FLV to MP3 Converter
- Free Wallpaper Changer
- Free DVD to MPEG Converter
- Free Doc Convertor
- Free Audio Editor
- Free Video to WMV Converter
- Free YouTube to FLV Converter
- Free MP3 Editor
- Free Video to MP3 Converter
- Free PDF Creator
- Free Sound Recorder
- Free AMR to MP3 Converter
- Free MOV to AVI Converter
- Free DivX Converter
- Free Wave To MP3 Converter
- Free Aquarium Screensaver
- Free XLS Viewer
- Free PDF to Word Converter
- DriverHub
- Your Link Here
- This site for sale
- Free HD Video Converter Factory
- WonderFox DVD Ripper Speedy 13.
- Vartika Zimbra to PST Converter
- Free Android Data Recovery 1.1.
- Aiseesoft Video to GIF Converte
- Google Selection Search 1.0
- Apeaksoft Free HEIC Converter 1
- Best PDF to Word Converter 3.5
- MSG Files Without Email Client
- DriverHub 1.1.2
- MSG Viewer Freeware 4.0
- Read PST File Opener Free Downl
- Free Download EML File Reader T
- Easy Photo Studio Free for Wind
- Easy Photo Studio Free for Mac
- PST File Reader Without Outlook
- Free YouTube to FLV Converter
- Free MP3 Editor
- Free Video to MP3 Converter
- Free PDF Creator
- Free Sound Recorder
- Free AMR to MP3 Converter
- Free MOV to AVI Converter
- Free DivX Converter
- Free Wave To MP3 Converter
- Free Aquarium Screensaver
- Free XLS Viewer
- Free PDF to Word Converter
- DriverHub
- Your Link Here
- This site for sale
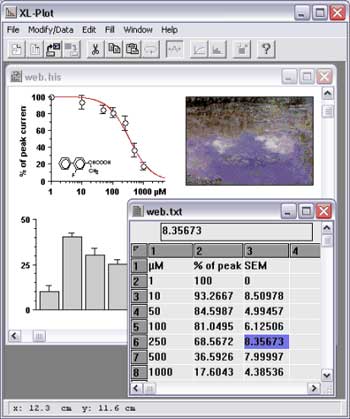
Download free program XL-Plot 2.99 for free
XL-Plot 2.99 for MS-Windows. Create your publication-ready graphs rapidly with XL-Plot. The primary purpose of XL-Plot is to create a
XL-Plot 2.99 for MS-Windows. Create your publication-ready graphs rapidly with XL-Plot. The primary purpose of XL-Plot is to create a figure rapidly. It is ideal for for use at high school, as the path from data in one or more spreadsheet columns to the final figure is short (just a few mouse clicks) and easy to grasp.
It contains basic statistical functions, such as Student s t-test and linear correlation of two sets of data (two columns in a spreadsheet). XL-Plot has a number of build-in functions that can be fitted to the data in columns on a spreadsheet or to a curve in a graph. The user can easily add fitting functions of his own design. Additional options are Fourier transformation, (de-)convolution, eigen decomposition and matrix inversion. XL-Plot is the eXtra-Light version of Serf, a program more specifically meant for electrophysiologists.